|
Routine |
Typically some deep thinking required,
but not necessarily a lot of coding. |
|
Hard |
Likely involves either a multiplicity of new concepts
and/or new mathematical concepts or algorithms. |
|
Really Hard |
Start immediately, think
hard, employ a stepwise refinement strategy and post concerns
as required. |
 The
Game of Life.
John Conway introduced the world to one of the most studied algorithms within the Cellular Automata family in the October 1970 issue of Scientific American. Read Wikipedia's explanation of the simple rules for propagation. In the applet to the right, I've colour-coded the cells as Birth, Survival and Death. Explore the game through either or both of the Explore links on the course page. Give yourself time to enjoy how such an elegantly simple set of rules can produce such fascinating outcomes.
The
Game of Life.
John Conway introduced the world to one of the most studied algorithms within the Cellular Automata family in the October 1970 issue of Scientific American. Read Wikipedia's explanation of the simple rules for propagation. In the applet to the right, I've colour-coded the cells as Birth, Survival and Death. Explore the game through either or both of the Explore links on the course page. Give yourself time to enjoy how such an elegantly simple set of rules can produce such fascinating outcomes.
Task.
- Read over the author's description of his version of the project on pp. 332-334.
- Add a third column to your Fractal
Framework applet
entitled Life.
- Design and implement a Drawable class called Life, modeled after this UML diagram (just kidding).
- Add a menu item under the Life menu that launches a random configuration of cells and propagates generations indefinitely. Glider Guns, Puffer Trains, and Tire Tracks are my favorites.
 Insertion Sort. In a process similar to our development of an animated presentation of the Selection Sort, work out an implementation for the Insertion Sort. Update your website wth the Framework applet that includes the two search algorithms (Sequential and Binary) as well as the two sort algorithms (Selection and Insertion).
Selection Sort. Together, we will integrate an animated presentation of the Selection Sort into our Framework Applet. As with the searching algorithms, our Sort classes will implement the Drawable interface. Examine the animated gif (below right) assembled from saved frames. I'll show you the technique for saving bufferedImage objects to disk into either .gif. jpg, or .bmp formats.
Task.
- To your Framework project and a new menu entitled, Sorts, and add the two menu items, Selection Sort and Insertion Sort
- Add two new Drawable classes, SelectionSort and InsertionSort whose constructor accepts only the resolution (similar to your searching classes).
- Within Framework's actionPerformed(ActionEvent ev) method, accommodate menu selections for these two activities.
- Provide an implementation of the Selection Sort as described in our text on pp. 628-636.
 Binary Search Animation. With the Sequential Search animation in place, you are to asked to adapt your animation skills to an implementation of the binary search algorithm depicting a similar rendering.
Task.
- To your Framework project, provide an implementation of the Binary Search algorithm.
- Add an explanation in your own words of the binary search algorithm to your Framework web page.
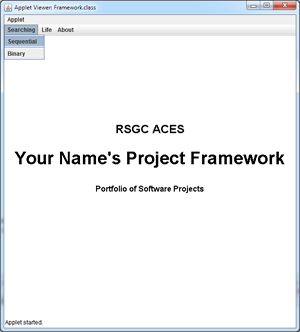 Project Framework. Anywhere, anytime access to your coding achievements will be useful to you. Therefore, the remaining projects for this year will be
embedded within your Project Framework applet and mounted on your home page.
Project Framework. Anywhere, anytime access to your coding achievements will be useful to you. Therefore, the remaining projects for this year will be
embedded within your Project Framework applet and mounted on your home page.
Task.
- Create project called Framework and drop in this driver.
- Edit your name into the two places that require it.
- Create web page to house the applet (HTML <applet> tag)and mount it on your Web Publishing site. Here's a sample.
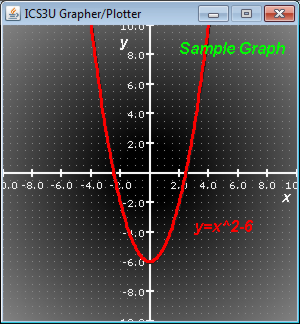
 Grapher. Done right, this is a highly rewarding exercise. Shallow thinking and/or poor time-management skills will quickly turn it into a frustrating
  . The more time spent thinking away from your laptop, the less time you'll spend in front of your screen, ultimately leading to a superior result.
First, some background preparation is required.
- The Grapher Application on Macs is well worth investigating. If you haven't done so already, explore both 2D and 3D Plots and their options.
- Remember Beckers' City constructor that accepted a file defining the initial configuration of the city? Here's an example.
- Recall Eclipse's ability to automatically generate constructors and methods based on well-planned field design. Well-understood and exploited, these RAD tools can significantly reduce class development time.

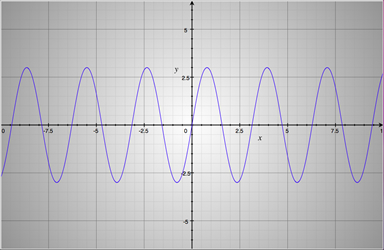
 Grapher 6. Saving Images. Due WEDNESDAY April 25. The ability of your Grapher application to save the image of your plot directly to disk in a recognized graphic image file format (.gif, .jpg, .png, .bmp, etc) is extremely convenient (not to mention essential for the final project of the year and the exam). I've used this ability to produce the graphics that have accompanied the description of the project stages below. As confirmation of your successful completion of this stage, you are simply asked to attach an image file of a plot of your own design and its corresponding script file to an email to handin by Wednesday April 25. (DevilsCurve.grp: the source for the image to the right came from here).
Task.
- Create a new project called GrapherSave and copy all the files from Grapher to it. The rationale being that if the changes you are about to make go awry, you'll still have a working version.
- Run the GrapherSave project to confirm it functions in a manner identical to Grapher.
- After reviewing Grapher UML 9.0 make the necessary changes to your GrapherSave and Plot source files as described in class, as well as adding two new parameters to the Frame tag in your .grp scripts.
To get you started, here's your new paintComponent method,
  	protected void paintComponent(Graphics g) {
		super.paintComponent(g);
		Graphics2D g2D = (Graphics2D) g;
		Rectangle bounds = this.getBounds();
		BufferedImage bi = new BufferedImage(bounds.width, bounds.height,
				BufferedImage.TYPE_INT_RGB);
		draw(bi);
		g2D.drawImage(bi, 0, 0, this);
		if (save) {
			saveImage(bi);
		}
	}
And here is the saveImage(BufferedImage bi) method,
  	private void saveImage(BufferedImage bi) {
		try {

			File file = new File(filename + String.format("%04d", filenumber++)
					+ "." + filetype);
			javax.imageio.ImageIO.write(bi, filetype, file);
		} catch (Exception e) {
			System.out.println("Exception found: " + e);
		}

	}
- The filename of the graphic file to be saved should match the filename of the script. To obtain this filename you can split the full name of the script file on the '.' character. Do you recall how we did this in an earlier project this year?
- After testing your code to confirm images are being saved of existing scripts, develop a script of your own, naming it Original.grp, from which you will obtain the image file, Orginal.gif. Attach both Original.grp and Orginal.gif to your email to handin. The highest credit will be reserved for those that demonstrate creativity and imagination in the selection and/or design of the Cartesian, Parametric or Polar plot.
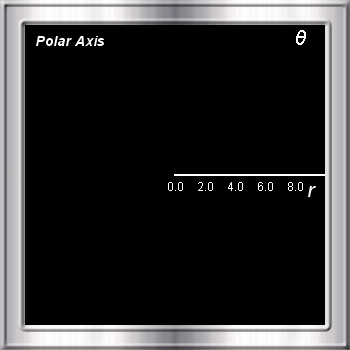
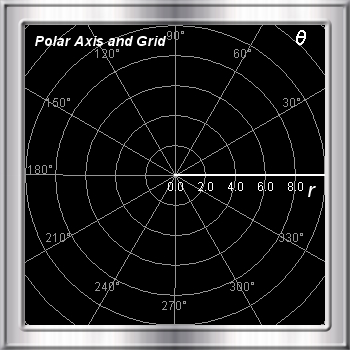
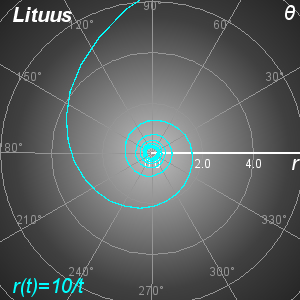
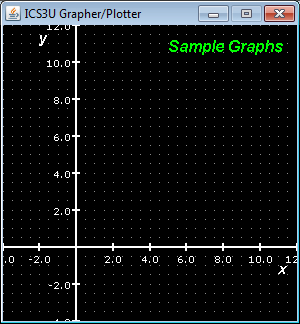
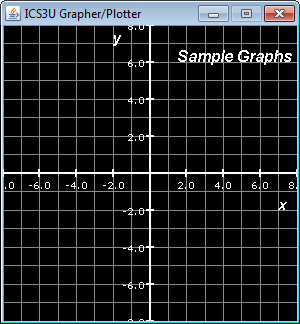
Grapher 5. Polar Curves. This stage comes in two parts. The first submission will demonstrate your application's support for both the Polar Axis and the Polar Grid. The second submission, a week later, will demonstrate full support for Polar Equations.
 Task 5a. Due Saturday April 14.
- Review the changes to the Axes and Grid classes found in Grapher UML v7.1.
- Download the PolarAxisAndGrid.grp script to the root folder of your Grapher project and compare the attributes of the Axes and Grid statements in this file to the changes you identified in Step 1. Once you are satisfied that you understand what is required, continue.
- Recall Unicode characters are rendered with the \unnnn escape sequence. You'll find the Unicode value for θ in the Greek Code Chart.
- Implement the necessary upgrades to your Grapher, Plot, Axes, and Grid classes.
- Confirm that your application renders the Axis image similar to the screen capture above left.
- Remove the # comment tag from Line 8 of the script and confirm your application renders the Axis and Grid image similar to the screen capture above right. For the concentric circles, use the draw method of the Graphics2D class to render objects of the Ellipse2D.Double class.
- Finally, try various modifications to the script file to ensure your application handles a variety of Axes and Grid parameter combinations.
 Task 5b. Due Saturday April 21. (Second-to-last Instalment of our Grapher Project)
- With the Polar Grid and Axes implementations defined by Grapher UML 7.1 in place, you can now turn your attention to the rendering of Polar relations. This will require changes to your Grapher, Plot and Equation classes.
- Once these upgrades are in place, add specific mathematical interpretations of the polar relation syntax defined within the 6 script files below to Equation's public double r(double t) method.
|
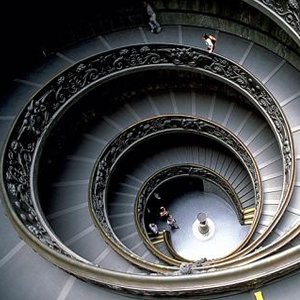
Vatican Staircase |
|
 |
|
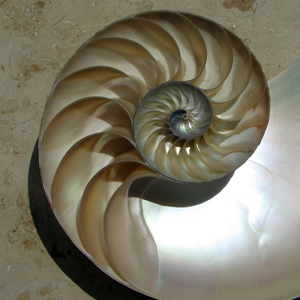
Nautilus Shell |
|
|
|
Seahorse |
|
 |
|
The Man Himself |
|
 |
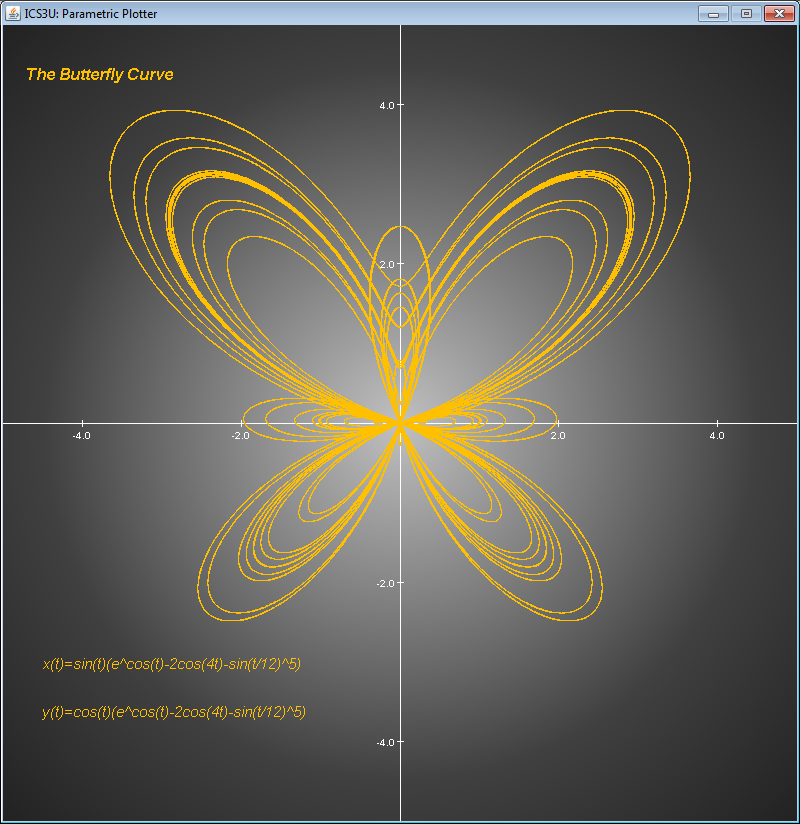
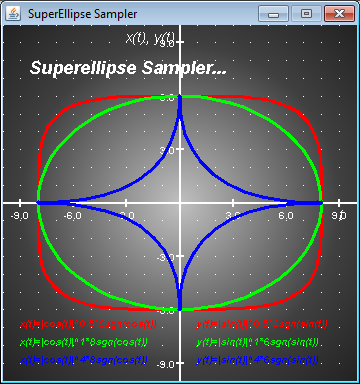
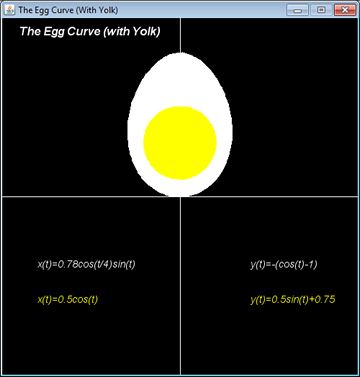
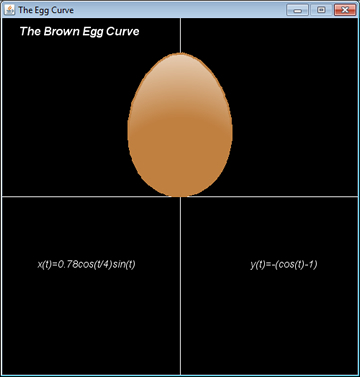
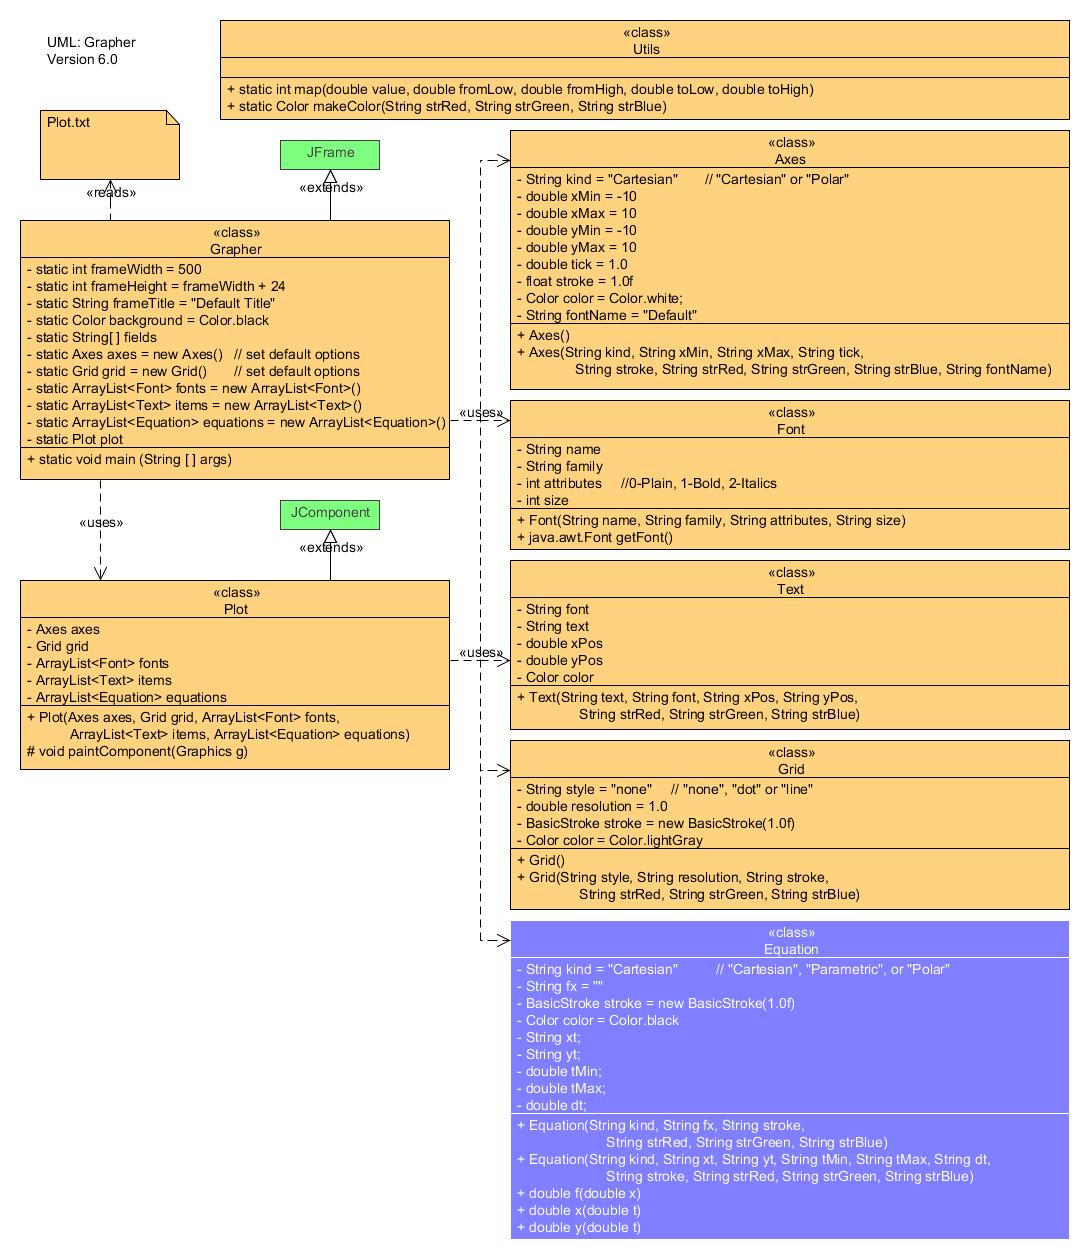
Grapher 4. Due Saturday April 7. Here's where your Grapher tool opens a wide window into the compelling beauty of mathematical shapes and forms (feel free to start developing over the Break). The image below right, aptly named The Butterfly Curve, is one of the many inspiring parametric curves you can readily generate. Click here for a larger image.
Task.
 Review the enhancement to the Equation class in Grapher UML v6.0.
- Incorporate the parametric implementation into your Equation class.
- Here's the script file used to generate the image to the right: Butterfly.grp. Add it to your Grapher project and explore its contents.
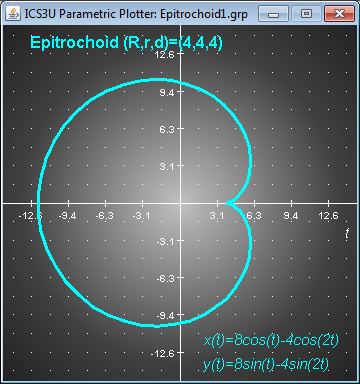
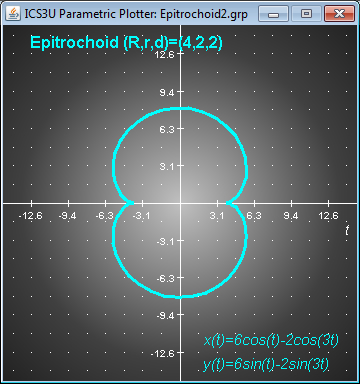
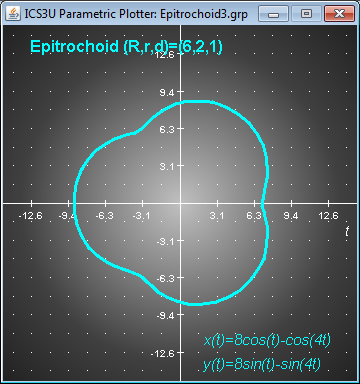
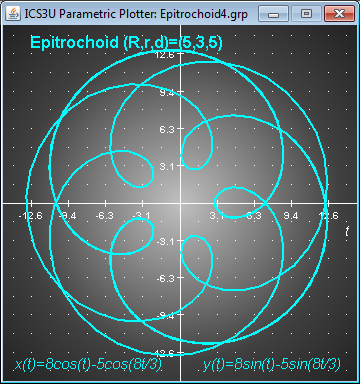
- A curve traced out by a point P relative to a circle rolling around the circumference of a fixed circle is called an Epitrochoid. The parametric equations have the form,
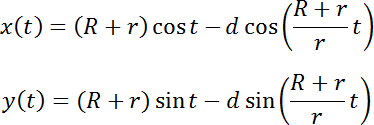
where R is the radius of the fixed circle, r is the radius of the rolling circle and d is the distance between P and the center of the rolling circle. I have prepared a short gallery of four examples below. The script files are included. Download each one to confirm your code.
- Upgrade your Grapher project to accommodate these eight new scripts. Submit all source files to handin by the deadline under the Subject Line, Grapher 4.
Grapher 3. Due Saturday March 10.
 In this final stage before the March Break you are asked to provide an implementation of the current Equation class as required by the UML diagram. That is, for the rendering of simple Cartesian functions.
- The strategy for plotting the function is to draw a sequence of short connected lines over the domain. This can be accomplished by initializing a variable, say x, to xMin and running a loop until x exceeds xMax. A suitable increment for x can be determined from existing information and the width of the component. Within the loop, the value of f(x) can be determined from the function of the same name defined within the Equation class. You are limited to the hardcoding of an if-else ladder of specific functions to evaluate as your skill does not yet permit you recognize mathematical syntax and parse accordingly. Maybe next year. A default return vaule of 1.0 would be required by the compiler but will not be engaged if your code and script file are properly synchronized.
- The colour of the graph of the Equation object and its corresponding Text label are to be coordinated.
- For the time being, develop a variety of continuous equations (polynomial, trigonometric and algebraic functions). As the week progresses we'll establish a common set of functions your code should be prepared to handle.
Finally. I've been curious about Mac Grapher's use of a radial gradient background in the screen capture I included above. While playing "an operator is standing by" Saturday afternoon fielding questions from distraught coders, I passed the time by adding the feature as can be seen to the right (no, you don't have to). For those that may be equally curious, here's the required code, tucked in just before the rendering of your Grid object.
	// Sample Radial Gradient background
	int x0 = Utils.map(0, xMin, xMax, 0, width);
	int y0 = Utils.map(0, yMin, yMax, height, 0);
	Point2D center = new Point2D.Float(x0, y0);
	float rad = width;
	float[] dist = { 0.1f, 0.4f, 1.0f };
	Color[] colors = { Color.BLACK, Color.DARK_GRAY, Color.LIGHT_GRAY};
	RadialGradientPaint p = new RadialGradientPaint(center, rad, dist,
			colors);
	g2D.setPaint(p);
	g2D.fill(bounds);
Grapher 2. Due Saturday March 3.
- Comments. Modify your Grapher driver to ignore lines of the text file that start with the hash character (#). This is useful for documentation as well as ignoring elements while debugging without having to remove the statement altogether.
- Replace your Plot.txt file with this one (if your code is functioning properly, it will generate the same outcome as the screen capture below left). Fields have been added to the Axes definition for color and tick font name. Modify your Axes class to accommodate these changes. Test your code.
- Review the Grid class defined in the UML diagram. The second field can either be none, dot, or line. An example of each of the latter two appears below. Add a complete implementation of the Grid class.
- Although you do not need to provide a full implementation of the Equation class until next weekend, a minimal implementation is required this week so that the Grapher driver will compile and run.
Grapher1. Due: Saturday February 25.
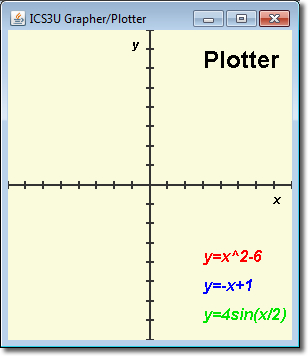
The plot of an equation similar to the one above right consists of numerous coordinated objects. In addition to one or more equations there is also set of axes, a grid, various fonts, text items and colour schemes that combine for a presentable result.
- Since we aren't ready for complex interactive menus and dialog boxes, the definition of a plot will be provided by a text file, loosely similar to Becker's City file. Here's a example of the tab-delimited file Plot.txt used to create the image to the bottom right.
- Review the UML diagram for this project. As you can see, there are a number of classes that require implementation for a plot to appear within your Graphics frame.
- Create the project, Grapher. Add in this skeleton driver. The name of the text file defining the plot will be supplied to the driver through the argument list (args[0]).
- Add implementations for those classes in the UML diagram depicted with an orange background by first laying in the instance fields, followed by the automatic generation of the constructor, the getters and setters, and the toString method.
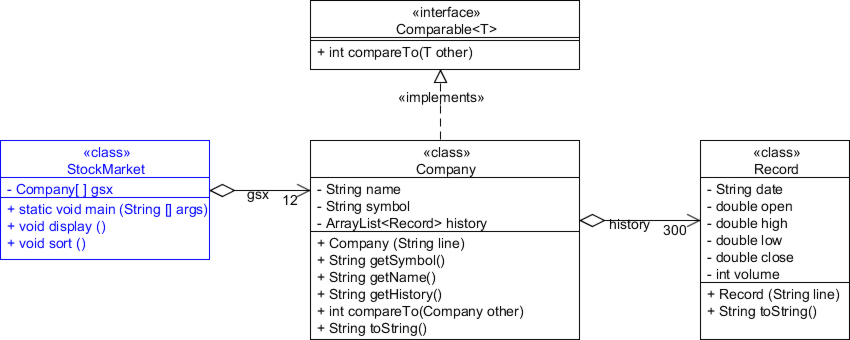
 Stock Market Project. With the basics of sorting algorithms established, it's time to move beyond the sorting of primitive data types (ints) to the task of sorting objects. Since the Economics class is all fired up over their Stock Market Challenge, we'll turn to stocks as the focus of this Project.
 Task A. (due: Monday February 6)
- First, we need data. Each of you has been assigned a company (see Table below). By midnight Monday February 6 you are to provide the historical data for your company to the group in the form of a .csv file with the filename ???.csv where ??? is the 2 or 3-letter symbol name. The data can be found at Yahoo Finance (Canada).
POT.TO |
Potash Corp. of Saskatchewan |
Alex |
RIM.TO |
Research in Motion Ltd. |
Anthony |
RY.TO |
Royal Bank of Canada |
Ian |
DOL.TO |
Dollarama Inc. |
Jack |
SU.TO |
Suncor Energy Inc. |
John |
ABX.TO |
Barrick Gold Corp. |
Justin |
CM.TO |
Canadian Imperial Bank of Commerce |
Kyle |
ENB.TO |
Enbridge Inc. |
Matt |
THI.TO |
Tim Horton's Inc. |
Michael |
TRP.TO |
TransCanada Corp. |
Mitch |
CTC.TO |
Canadian Tire Corp. |
Rafe |
BCE.TO |
Bell Canada Enterprises Inc. |
Scott |
After submitting the full symbol name below (include the .TO to ensure the quotes are in $CAN from the listing on the TSX) in the Get Quotes text box, look under the Historical Prices of the left navigation panel.
Once the data is displayed, scroll down to the bottom and
select Download to Spreadsheet. Choose to open this file as table.csv (comma-separated values). Since we need the data from the most recent 300 trading days, starting with the closing data for Friday February 3, delete Row 1 (column headings), delete Column G, and then all but the first 300 remaining rows. Save the file as a CSV file under the name ???.csv where ??? is your 2 or 3-letter symbol. Here's an example for Telus Corporation: T.csv. Attach your file to an email to the ICS3UForum under the Subject: ???.csv so everyone can obtain a copy of your file for the next stage of the Project.
Task B. (due: Saturday February 11)
 Create a project entitled StockMarket and add the text file GSX.txt to the root folder of the project as well as the 12 data files posted by the ACES to the ICS3UForum.
- Examine this UML diagram. Implementations of the classes are required.
- Examine the contents of the GSX.txt file. The driver uses the contents of the GSX.txt file to populate its gsx (Georgian Stock eXchange) array, before calling its sort() method to order the contents of the array by Company symbol.
- The Company constructor accepts a line of data read by the driver and parses it into the name and symbol data. The constructor uses the symbol to create the filename containing the historical records for the Company. Before finishing, the constructor will read the data in its file and construct the records required to populate its history ArrayList.
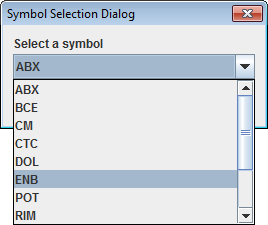
- Review this Tutorial on Making Dialogs. JOptionPane provides an number of overloaded showInputDialog() method. Using the one that offers a dropdown box (right), present the list of available symbols in the dropdown box for the user to choose from. Handle the event that the user may wish to Cancel instead of making a valid selection, otherwise arrange to have the selected Company's information and price history displayed to the console window similar to this sample. Be sure to format column alignment as depicted.
 Task C. In-Class: February 14
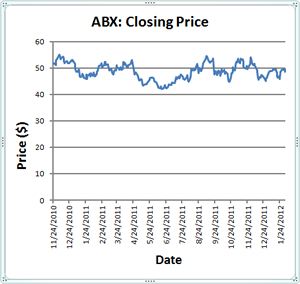
The goal of this stage of the Stock Market project is to advance your Graphics skills far enough to be comfortable with a rendering of a line chart. Specifically, we would like to select one of the 12 companies we have data for (through the same Input Dialog), only this time, instead of just displaying the price history of the selected Company, we will display the closing price over the 300-day period as a line chart similar to Excel's effort that appears to the right.
Task.
- Select your StockMarket project and open the StockMarket driver. Save the source file as StockMarketC.java in the src folder of the same Project.
- In a manner similar to the ChartOps project we developed last Friday, enhance your StockMarketC class to extend JFrame.
- While retaining the current contents of the main method for the time being, add statements to the driver that will add an instance of a LineChart class we have yet to implement.
- Using this crude UML diagram, implement a skeleton LineChart class so that the project compiles.
- If you haven't done so already, add the accessor method public double getClosingPrice() to your Record class that returns the closing price for that trading day.
- Add the accessor method public double[] getClosingPrices() to your Company class that returns an array consisting of the closing price for each trading day in your history list. Add a call to Company's getClosingPrices()method from LineChart's constructor to secure he dat to be rendered.
- Add statements to LineChart's paintComponent(Graphics g) method to draw the x and y-axis.
- To prepare for the rendering of the line chart, determine the highest closing price so wenknow how to scale the dependent (Price) axis.
Task D. In-Class February 16.
- Draw horizontal gridlines as depicted in the Excel chart above right.
- Review the Font class. Instantiate the instance fields, fntAxis and fntTitle. Using Graphic2D's drawString() method, label the axes and title the Chart.
- Review the BasicStroke class. Instantiate the instance field, stkLine to a BasicStroke object of your preferred thickness.
- Implement the method, private double map(value, fromLow, fromHigh, toLow, toHigh) that returns a number remapped from one range to another.
- Using Graphic2D's drawLine() method, iterate through the closing prices array, drawing lines as you go.
- Apply colour options to jazz up your Chart.
- Further details provided in class.
 Euler Problem 73. Your current examination of searching and sorting algorithms has introduced you to two new major coding considerations,
- The issue of the efficiency of algorithms, and,
- recursion
Euler Problem 73 combines both of these issues as well as the concept of coprime numbers.
Task.
- Create a project under the name Problem73 and add a driver by the same name.
- Develop a solution to the Problem for d ≤ 60 000. Do not use Arrays.sort().
- When finished, your output should include both the number of milliseconds it took to complete the task and the answer. To accomplish the former, record the time before you begin your algorithm (System.currentTimeMillis()) and subtract it from a second call to the method when the process is finished.
Your solution must run in under 1 min (60 000) ms and a small premium will be awarded for code that runs in less than half that time on my laptop. To accomplish this, you'll have to think about the problem deeply and find ways to eliminate unnecessary or inefficient steps and coding decisions.
 Spy Tools. Given the recent outing of a naval intelligence officer in the Canadian Armed Forces for alleged spying and the subsequent departure of a number of
Russian Embassy staff from Ottawa, it seems an appropriate time to participate (to some extent) in the subterfuge.
Spy Tools. Given the recent outing of a naval intelligence officer in the Canadian Armed Forces for alleged spying and the subsequent departure of a number of
Russian Embassy staff from Ottawa, it seems an appropriate time to participate (to some extent) in the subterfuge.
Your task is to develop an application to decode the text file Encoded.txt. Fortunately, it turns out the file has been encoded using a simple frequency replacement cipher. Here's the decoding strategy.
- Each letter in the original text was replaced with the letter in the same relative position within a 26-letter key based on the sorted frequency of each letter (ascending order). As luck would have it, your contact has intercepted the letter frequency within the original text: etoasrnihldfcubmwygpvkjxqz.
- Other characters (punctuation, CR/LF, digits, etc.) are to be left untouched.
- The case of each letter (upper/lower) is to be preserved.
- Your console output will include only the decoded text.
Finally, after a tough weekend, many of you responded well and the classes we had last week made one or more adjustments. Thank you, but one week does not a tournaround make. So, for this assignment all that I ask is the driver be named SpyTools. This open specification will give committed students a chance to prove themselves and cement their rededication to independence given that two similar submissions would be unlikely unless you're working too closely with your peers.
I'm available for consultation each day after school (and the Forum is available 24/7) but don't leave it too late, this will take time.
 Searching Algorithms. You will recall in iTunes1 we undertook an introductory look at searching for records in a database that matched given criteria. We now formalize the two conventional searching algorithms in the next few classes: Linear (Sequential) Search and the Binary Search.
Linear (Sequential) Search
- Create a project called SearchingAlgorithms and drop in this driver. Examine the driver closely to determine from the code and documentation the techniques used and the code that is missing.
- Download the Music1.txt file to the root folder of the project.
- Implement the Track class from this UML diagram. Document fully.
- Provide a body for the linearSearchByName(String name) method.
Submit your source code for both the completed SearchingAlgorithms driver and the Track class by the deadline. Subject: Linear Search.
Binary Search (next week)
BINGO! This
three-part assignment is designed to solidify your array and Arraylist<E>
skills.
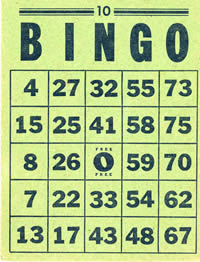 Bingo1: Bingo Card. Create a project called Bingo1 and add
this driver. As you can see, the driver simply instantiates and
displays an instance of a BingoCard class.
Provide an implementation of the BingoCard class
that follows this
basic UML design. You output should
look similar to the capture below.
Bingo1: Bingo Card. Create a project called Bingo1 and add
this driver. As you can see, the driver simply instantiates and
displays an instance of a BingoCard class.
Provide an implementation of the BingoCard class
that follows this
basic UML design. You output should
look similar to the capture below.
 Bingo2: Bingo
Player.
In this stage you will simulate a single-player Bingo Game. A player
has a name and
can have as many cards as he chooses. The driver loads the 75 possible calls
(B1 to O75) into an array and then randomizes the array. The driver loops
through
the
calls
and the player marks an X on each card that matches the call. Before returning
for the next call, the driver calls the player's isWinner() method
that, in turn, calls each of his/her card's isWinner() method
to determine whether any of the player's cards is a winner (12 ways per card).
If there
is a winner, play stops and the total number of calls is displayed, together
with the state of
EACH
of the player's cards for visual verification.
Bingo2: Bingo
Player.
In this stage you will simulate a single-player Bingo Game. A player
has a name and
can have as many cards as he chooses. The driver loads the 75 possible calls
(B1 to O75) into an array and then randomizes the array. The driver loops
through
the
calls
and the player marks an X on each card that matches the call. Before returning
for the next call, the driver calls the player's isWinner() method
that, in turn, calls each of his/her card's isWinner() method
to determine whether any of the player's cards is a winner (12 ways per card).
If there
is a winner, play stops and the total number of calls is displayed, together
with the state of
EACH
of the player's cards for visual verification.
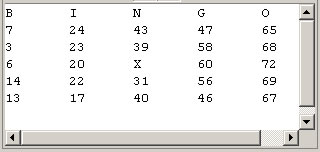
Task. Create
a new project entitled, Bingo2 and
drop in this driver. Configure Bingo2's
Build Path by adding the Project Bingo1 so you only have one version of the BingoCard class. Following this
UML diagram, create a BingoPlayer class
and implement the enhancements to your BingoCard class. Sample output appears to the
right.
Attach Bingo2.java, BingoPlayer.java and BingoCard.java files to an email to handin under the Subject Line: Bingo2.
Bingo3. Bingo
Game. The
final stage of out Bingo Trilogy should be obvious. You are to simulate
a multi-player Bingo
Game. In the past few lessons you have been introduced to Java's ArrayList<E> class
that offers users a suite of methods for the convenient manipulation of arrays.
So, just as the Integer and Double classes
are wrapper classes for ints
and doubles respectively, the ArrayList<E> class
can be thought of as a wrapper for arrays.
Task. Create a project called Bingo3. Configure Bingo3's Build Path to include your Bingo1 and Bingo2 Projects. Add the text file Players1112.txt to
the Bingo3's root folder. Examine the contents of the file. The data file has a
number of records that contain two fields each (the player's name and number
of cards),
separated
by a tab. Using much of Bingo2's driver code, create the driver for Bingo3 that
populates an ArrayList<BingoPlayer> container with the data from Players1112.txt.
Then, undertake a Bingo game in which all players (and all their cards!) participate until a
winner is identified. For verification, print out ONLY the winning player(s)
and all of his cards. Note: I will use a different Players1112.txt file
(with the same field structure) when I evaluate your project.
 The Sieve of Eratosthenes. There
is no known efficient procedure for finding prime numbers. A classical, but tedious,
method attributed to Eratosthenes (276 - 196 BC), can be described as follows.
First, write down a list of integers, paired with true values,
The Sieve of Eratosthenes. There
is no known efficient procedure for finding prime numbers. A classical, but tedious,
method attributed to Eratosthenes (276 - 196 BC), can be described as follows.
First, write down a list of integers, paired with true values,
2 3 4 5 6 7 8 9 10 11 12 13 14 15 16 17 18 19 20
T T T T T T T T  T  T  T  T  T  T  T  T  T  T  T
Then mark all multiples of 2 by switching its true to false,
2 3 4 5 6 7 8 9 10 11 12 13 14 15 16 17 18 19 20
T T F T F T F T  F  T  F  T  F  T  F  T  T  T  F
Move to the next unmarked number, which in this case is 3, then mark all its multiples:
2 3 4 5 6 7 8 9 10 11 12 13 14 15 16 17 18 19 20
T T F T F T F F  F  T  F  T  F  F  F  T  F  T  F
Continue in this fashion, marking all multiples of the next unmarked number until there are no new unmarked numbers. The numbers which survive this marking process (the Sieve of Eratosthenses) are primes.
Task. Write the class, Sieve,
that will implement the Sieve
of Eratosthenes
and determine the prime numbers from 2 to n-1, where the integer n
is determined by the user.
Your program will create an array of length n, initializing all cells
to true. Starting with array index
2, (ignore index 0 and index 1), every time an array
element
is found
to
be true,
loop through the remainder
of the array
and set to false every element
whose index is a multiple of the starting index.
At the end of the implementation, array elements that remain true have an
index which is a prime number.
Display the
prime numbers to the console.
We'll try something new
this week. Students can submit either Trigonometric Functions as
defined below or Exercise P6.1, CurrencyConverter.
In the case of the latter, a 30%
discount
will be applied to the earned mark.
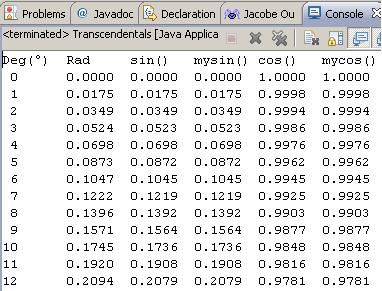
Trigonometric
Functions. The Math class
offers a wide variety of mathematical tools for use by clients. (the
trigonometric functions are members of a class of functions known as transcendentals
in that the exact value can't be computed precisely, but rather is approximated,
typically through the addition of successive terms in a well-defined series)
Degrees (d) to Radians (r). The Math class
offers two built-in conversion methods, toDegrees(double
angrad) and toRadians(double
angdeg) for your convenience that implement the following definitions,
Infinite Series Approximations of the trigonometric functions
sin(x) and cos(x), x in
R (radians)
Task.
- Create a new project called Trigonometry and drop in this driver.
- To
your NumericalMethods class,
add implementations for the following two methods,
public static double sin( double angle)
and
public static double cos( double angle)
based on the two series above that can be used to confirm the accuracy of
the built-in methods of the Math class.
If your NumericalMethods class
works properly, the project will yield the output below (up to 360°).
- Enhance the driver by adding two columns for tan(x). The first of the two
columns combines the results previously obtained and the second calls the
tan function from the Math class.
Submit your enhanced Trigonometry.java driver
and NumericalMethods.java classes
by the deadline.
Project
Euler: Problem 12.
One
Star Exercises. (Since some
of you are struggling to complete the single weekly challenging assignments,
we'll take a different tact this week to see if we can restore some confidence
and prep for next Tuesday's test at the same time.)
Pages 222-223 contain
eight Programming Exercises considered easy by the author (ExP15_4,
ExP15_5,
and
so on). You
are to do
them all. Attach fully documented sources files, correctly named, to an
email to handin with the Subject: One Star Exercises, by the
deadline. I will evaluate one of them at random.
Line. At this point in your development, it is no longer sufficient to produce code
that simply works, you have to think deeply about the exercise, use the appropriate
tools, and code in justifiable efficiencies. Consider Exercise P5.15 on
page 224, henceforth known as,
LineTest.
Using
this LineTest.java driver,
develop the UML diagram as the file Line.uxf and
implement the Line class
as required to produce this
output. Attach Line.java and Line.uxf to an email
with the requested ubject to handin by the deadline.
iTunes1. To gain familiarity with boolean operators and expressions, we'll query a database (text file) for data that match specific criteria.
Task.
- Create a project entitled iTunes1, a driver by the same name, and add the text file Music1.txt to the root folder of the project. This file (database table) contains over 500 records for which 8 fields are offered (Title, Artist, Composer, Album, Genre, Size, Time & Year). Fields are separated by a tab character.
- Read access to a text file can be established as follows (see pp. 498-500 if you're interested),

Add the above code to the main method of your iTunes1 driver.
- Using your Scanner object, read in the first line of text in the file and display it to the Console Window.
- Write a conditional loop around a call to your Scanner object's nextLine() method to read in each record of the database and a System.out.print statement to display the each record to the Console Window.
- Inside the loop, split each record of the database into an array defined by String fields[] to enable you to identify records that match various criteria.
Now, construct boolean queries to determine the number of matches for each of the stated criteria below. (Note: You many wish to open Music1.txt in Excel to confirm the data sets your queries produce)
- Display the number of tracks whose Title field starts with the word, You.
- Display the number of tracks whose Title field includes the word You or you in any position.
- Display the number of tracks from 1967.
- Display the entire record for any track from the 60s. Display the number of tracks at the end.
- Display all tracks by the The Beatles not composed by George Harrison or Ringo Starr that are less than two minutes. Display the number of tracks at the end.
- Display all Pop or Rock tracks that are over 5 MB. Display the number of tracks at the end.
exactly |
Bingo!! |
1 |
Jedi |
within 1 |
Hot! |
2 |
L337 |
within 2 |
Warm |
3 |
Peasant |
otherwise |
Cold |
otherwise |
n00b |
 Oracle.
We examined a strategy that could be used to test for the virtual equality
of doubles to avoid problems
associated with roundoff error. Although we'll be using ints
in this assignment, you'll construct a similar test to evaluate your
users' powers of deductive reasoning. Your Oracle object
(see UML diagram) will randomly (Random or Math class)
generate an integer over the closed interval [0, 9] and keep it
secret. In your driver, OracleTest,
you will instantiate an Oracle object
and subsequently
ask the
user to submit up to three guesses. Using strategic Oracle method
calls within if...else ladders
(no loops!) take the user through the guessing game and label him
according to Table
2.
Oracle.
We examined a strategy that could be used to test for the virtual equality
of doubles to avoid problems
associated with roundoff error. Although we'll be using ints
in this assignment, you'll construct a similar test to evaluate your
users' powers of deductive reasoning. Your Oracle object
(see UML diagram) will randomly (Random or Math class)
generate an integer over the closed interval [0, 9] and keep it
secret. In your driver, OracleTest,
you will instantiate an Oracle object
and subsequently
ask the
user to submit up to three guesses. Using strategic Oracle method
calls within if...else ladders
(no loops!) take the user through the guessing game and label him
according to Table
2.
 Task.
You are to give the user no more than three attempts
to discover the secret digit. Summarize each game by labeling the player's
outcome
according to Table 2. In addition to printing the label, also display
the secret number for confirmation purposes (not
before as in the two examples). Use as many elements of good
coding conventions and style that
we have discussed and submit OracleTest.java and
Oracle.java to handin by the
deadline.
Task.
You are to give the user no more than three attempts
to discover the secret digit. Summarize each game by labeling the player's
outcome
according to Table 2. In addition to printing the label, also display
the secret number for confirmation purposes (not
before as in the two examples). Use as many elements of good
coding conventions and style that
we have discussed and submit OracleTest.java and
Oracle.java to handin by the
deadline.
 Comparing
Objects: Prioritizer. (In class) You are aware that the equality operator
(==)
is
not used to compare the values of two objects. The preferred technique is to
add
the
method, public
int compareTo(Object other)to any class that requires a signed integer
ranking
between the implicit parameter (this)
and the explicit parameter (other)
instances of the
class.
Comparing
Objects: Prioritizer. (In class) You are aware that the equality operator
(==)
is
not used to compare the values of two objects. The preferred technique is to
add
the
method, public
int compareTo(Object other)to any class that requires a signed integer
ranking
between the implicit parameter (this)
and the explicit parameter (other)
instances of the
class.
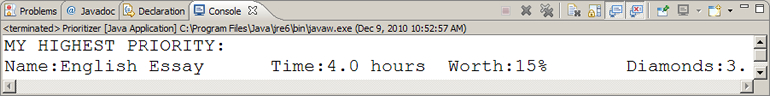
To assist in the prioritization of assignments that require completion,
you
are to develop software to tell you what your highest priority task is.
- Create a project called Prioritizer, drop
in the driver Prioritizer.java,
and review the code. The WorkLoad class
maintains an array of Assignment objects.
The Assignment class encapsulates
information about an individual assignment that includes its name,
completion
time, worth,
and diamond rating (difficulty).
- Implement the code
for the WorkLoad and Assignment classes
using the UMLs below as a template.
- For now, Assignment's compareTo method
should return the integer value based on the worth instance
field.
- Use the String.format() method
in Assignment's toString()
method to assemble a formatted String similar to the output shown below.
 Drow2. In the second instalment of the Drow trilogy you are to demonstrate
the ability to read the contents of a user-selected text file and display it
in a graphic context.
Drow2. In the second instalment of the Drow trilogy you are to demonstrate
the ability to read the contents of a user-selected text file and display it
in a graphic context.
Task.
- Create the project Drow2 and
drop in this source code. Test it so
that it runs either as an application or as an applet.
- Develop the Content class
further to enable users to select a text
file through the use of a JFileChooser object.
- Enhance the class by adding statement's to Content's paintComponent method
to display the contents of the text file in its window. For now you can
assume that the file does not contain so many lines that it requires
horizontal and vertical scroll bars to see it in its entirety (we may
address that capability in a later assignment).
- Document the code you add and mount the applet version on your website.
- Submit
Drow2.java to handin by the deadline.
IP
Address. (This assignment will give you practice manipulating numerical
and String data
in the analysis of an Internet Protocol (IP) address) The purpose of this
assignment is to allow the user to enter an IPv4 address in dotted-decimal
form and the software
will convert it to it's binary equivalent (if it is valid). You can restrict
the reasons for an invalid address to either an incorrect number of octets
(there
should be exactly 4) or the value of any given octet is out of range (it
must be between 0 and 255, inclusive). Take a test
drive of the final project. In addition, you are
encouraged to look carefully and the driver's
use of JOptionPane's
input and output dialog boxes. Use these dialogs where appropriate in the
assignments
ahead.
Task.
- Read Wikipedia's article on the structure of the IP
address. We'll restrict ourselves to the IPv4 protocol for this assignment.
Click here for
your IP address.
- Create a project called IPAddressTest and
drop in this driver. Review the
driver thoroughly for both the javadoc and the handling of the
Dialogs.
For those that are interested more
information on Dialogs can be found here.
- Create the class IPv4 that
models the UML diagram to the right.
- Develop the code necessary to have your project function similarly to the
example.
- Once completed, mount an executable jar version of your project on your
web site.
- Finally, submit the fully javadoced IPv4 source
file to handin by the deadline.
Newtons' Method for (Square) Root Finding. There is
no (easy) direct computation of the square root of a non-negative real number.
However,
numerous
algorithms
exist for determining an approximation to it. One useful algorithm,
sometimes referred to as Newton's Method,
can be described as follows.
Suppose the goal is to determine the square root of 20, call it x.
Since 16<20<25,
we know the answers lies somewhere between 4 and 5, likely closer
to 4. In some situations, we could stop here, offering 4 as the square
root of 20. But, like any good competition, a better
approximation would be impressive. Try this. If we let x=4,
Newton
suggested,

would result in an
improved approximation. A quick calculation yields a result of 4.5. Squaring
4.5 produces 20.25. Not bad.
Newton's prediction appears to be correct.
Ok,
from 4 we calculated 4.5. Is this the end of it? Is this the best approximation
we can come up with?
Task.
Create a project called NewtonTest and drop in this
driver. Next, create a static NumericalMethods class
and implement (at least) the following two methods,
	/**

* sqrt returns an approximation to the square root of  the number a,

*  given an initial guess of x, using n iterations of Newton's Method

*  @param a the radicand

*  @param x the initial approximation to the square root of a

*  @param n the number of iterations of Newton's Method

*/

public static double sqrt(double a, double x, int n)
and
	/**

* sqrt returns THE BEST approximation to the square root of  the number a,

*  given an initial guess of x, using  Newton's Method

*  @param a the radicand

*  @param x the initial approximation to the square root of a

*/

public static double sqrt(double a, double x)
Your
code should yield the output below. Submit your NumericalMethods class
by the deadline.
Drow.
(This is the first of a 3-part assignment)
Read Exercise
P3.8 on page 127. Review the How To 3.1 Implementing a Class Section
on pp.99-101. Recall Stepwise Refinement from last year.
Task.
- Create a project called Drow and add a minimal driver class by the same
name.
 From the description of the Exercise, identify the methods and instance
fields that are required.
From the description of the Exercise, identify the methods and instance
fields that are required.- Using your UMLet utility, design the public and private resources of the Letter class
and save it as Letter.uxf to
your ICS3U folder. Also, save your UML diagram as a gif image and import
it into your images folder in F/C Web Publishing.
- Add the Letter class to
your Drow project and document
the public interface defined in your UML diagram. In
addition to the text-based class javadoc of Letter,
provide a link to your Letter.gif image in F/C.
- Implement the constructor(s) and methods of the Letter class.
- Add statements to your Drow driver
class to test your Letter class.
Document your Drow class.
Toyota Logo Revisited. In preparation for next week's larger graphics
application, you are asked to make a few improvements to your previous Toyota
application.
Positioning and Proportion Improvements.
- Ellipses. When the window is resized, your logo should
adjust accordingly, maintaining its proportionality and its centered position
with
the frame.
Recalling that every JComponent's
paintComponent(Graphics g) method
is called by the Java Virtual Machine (JVM) when itis ready to have the panel
updated, you must include
code to obtain the new dimensions of the panel every time. JComponent's getSize() method
returns a Dimension object
that can be mined for the active width and height of the drawing area, as
in,
Dimension dim = getSize();
Determining the coordinates of the center of the panel is simply a matter of
averaging the two measures, while accounting for the height of the title bar.
With
the
center
known,
constructing
the
rectangular
bounding
areas of the three
ellipses
is straightforward. The only concern you have is allowing enough room at the
bottom for
the TOYOTA name.
- Text. Again, when the window is resized, the TOYOTA text
must be dead center underneath the ellipses. In your previous attempt, most
students simply used trial and error to guess what the position of the text
should be. As you will see, once you have the ellipses dynamically repositioning
and resizing themselves, a static position and font size for the text is inadequate.
The good news is that every chunk of graphics text has a bounding rectangle.
The key, then, to properly positioning graphics text is not unlike manipulating
any rectangle.
The FontMetrics class of
java.awt encapsulates information about the measure (metric) of a given font.
Coincidentally, the Graphics2D class
has method called getFontMetrics() that
returns a FontMetric object
that can be manipulated to reveal the bounds of a given String object within
the
current graphics environment in the form of a Rectangle2D object.
Task. By the deadline, remount your (improved) Toyota.jar application
on your website and submit your source code to handin.
 Toyota
Logo.
For your first Java2D graphics assignment you are asked to recreate
the
familiar
logo. Create a graphical application called Toyota that
renders the logo to the right as closely as you can. Some of the areas you will
need
to
investigate
include,
Toyota
Logo.
For your first Java2D graphics assignment you are asked to recreate
the
familiar
logo. Create a graphical application called Toyota that
renders the logo to the right as closely as you can. Some of the areas you will
need
to
investigate
include,
- the java.awt.geom.Ellipse2D.Double class
- various Graphic2D methods including draw() and setStroke()
- the java.awt.Font and FontMetrics classes
Note. An important consideration is the scalability of your
rendering. As can be seen from this example,
as the frame is resized, the image remains proportional, centered horizontally
and scaled to ensure it remains entirely
within the panel.
Project Euler: Register. You
are asked to create an account with Project
Euler and send me an email to handin that contains your Username and Password
(I will use this information over the course of the year to monitor your progress).
Optional: Try
to complete one problem (any problem) by Saturday deadline.
Project 4.1. Consider Project 4.1 as
specified on pp. 179-180.
- Using a Stepwise Refinement approach, develop a UML diagram for the Triangle class. Consider all necessary instance fields and methods.
- Create a Java Project called, Project4_1.
- Add a driver class by the same name to the Project. Within the main method, instantiate an object of the Triangle class.
- Add a Triangle class to the Project and implement instance fields and method stubs as required by your UML diagram so that the Project compiles without exceptions. Incorporate appropriate commenting as you go.
- Undertake the implementation of the method bodies, starting with Triangle's constructor.
- Develop a variety of well-thought out test cases to fully exercise your Triangle class. Be sure to examine the output carefully (don't simply assume the results are correct)


