The purpose of this investigation is to get you started in the direction of writing graphic applications in Java.
 Task 1.
- Create the project ChartOps and a driver by the same name modeled after the example on page 59 of our textbook. Declare two static class variables width and height and set the frame dimensions to width×height = 500×500. Set an appropriate frame title.
- Create the class VerticalBarChart modeled after the RectangleComponent class described on page 61 of our textbook.
- After reviewing the RectangleViewer class on page 62, define a static class variable VerticalBarChart vbc add the necessary statements to ChartOps to view the two rectangles.
Task 2.
- Add the Searching project to the Build Path of ChartOps so we can exploit the use of the ArrayUtil class.
- Define the static class variable int[] data and instantiate an array of 50 ints in the main method of ChartOps driver ranging between 0 and height-50.
- Modify the VerticalBarChart constructor to receive and record data as its only parameter.
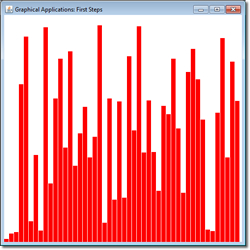
- Modify VerticalBarChart's the paintComponent method to display the array as a vertical bar chart.
- Correct the display of the rectangles to compensate for the origin being at the top left of the frame.
Task 3.
- Add a sort() method to ChartOps to order the elements of the data array.
- Add the method public void setData(int[] data) to VerticalBarChart to enable users to update its encapsulated array.
- Request the array be redrawn by calling vbc's repaint() method.
- A delay can be initiated by adding the code below. Embed this code within your sort() method to enable you to view the swapping activity.
  	try {
		Thread.sleep(1000);
	} catch (InterruptedException e) {
		e.printStackTrace();
	}