Exploring the Fractal Geometry of the Mandelbrot Set |
 Automated
Image Sequencer. The time has come for you to take your
place in ACES history and join the ranks of those who have gone before
you. All ACES
are required to submit the final version of their Platform project
that will yield
an
animated entry into our Fractal
Archive. As you can see, your name is already there. Last
year's was the weakest effort as you can see by the number of students whose
name appears, but no video follows. These students bombed the exam.
To avoid a similar fate, do a good job with this last stage.
Automated
Image Sequencer. The time has come for you to take your
place in ACES history and join the ranks of those who have gone before
you. All ACES
are required to submit the final version of their Platform project
that will yield
an
animated entry into our Fractal
Archive. As you can see, your name is already there. Last
year's was the weakest effort as you can see by the number of students whose
name appears, but no video follows. These students bombed the exam.
To avoid a similar fate, do a good job with this last stage.
There are a number of careful considerations that must be made in order to produce a good animation. Look at this example. This is a poor offering for a host of reasons that include: a zoom factor that is too high (0.50-you'll likely prefer a value between 0.90 and 0.99 to be smooth), at 30 frames, it's too short (between 150 and 200 are required to keep the viewer engaged), and at deeper depths there weren't enough iterations to provide the necessary detail (you'll probably want to be between 500 and 1000).
A good animation will synchronize smooth manipulations of both scale and position. However, since we're only able to devote one class session to this development, we'll focus exclusively on changing scale and work with a fixed position. An awkward jump from the default center at -0.75+0i to the centre of your zoom sequence ca nbe avoided by starting with a very large domain similar to the grapihic to the right (this will add some suspense as well!). Note: Inspired explorers can choose to remain after class and I will discuss the position considerations. Enough talk, let's begin.
- Using your manual Mouse Zoom capabilities, dig deep into the M-Set, identifying
the Complex coordinates of a target destination for your video sequence.
To assist this process, you should report the corresponding Complex coordinates
of the mouse click to the Console Window along the way. One of the interesting
features of any video is how deep it actually penetrates the Set.
This begs the question, "How deep can we go?". After reflection you realize it would depend on the domain and range having 400 (or whatever dimension your screen canvas is set to) different values to work with. If there are less than 400, rounding would yield two or more blocks of similarly coloured pixels, degrading your resolution. Now, since your domain and range are doubles, this is currently the limiting factor relating to the depth. Since the primitive double type has an accuracy of roughly 15 significant digits, when your domain approaches this value, you're about as deep as you can go. Consequently it would also be wise to report the domain to the Console Window so you can monitor your depth (for inspired Mandelbrot explorers, switching to the BigDouble class removes this restriction and you can go as deep as RAM will allow, but with obvious performance degradations).
- To your KeyPressed(KeyEvent em) method,
you add code to initiate the creation of your sequence on the pressing
of the v key. At this point
make a call to your Content class's generateFrames() method,
  public void generateFrames() {
    int frames = 10;
    // Parameters: vCentreX, vCentreY, vDomain, vZoomFactor, frames
    mandelbrot.setVideoProperties(-0.1732986271032131, 1.0601239993629323, 30, 0.50, frames);

    zoomLevel = 1;
    Graphics g = this.getGraphics();

    for (int f = 0; f < frames; f++) {
      System.out.println("Drawing Frame:" + zoomLevel);
      drawMandelbrot(g);
      screenCapture();
      // Updates viewing parameters for the next frame:
      // domain, leftBound, rightBound, bottomBound and topBound
      mandelbrot.nextFrame();
      zoomLevel++;

    }
  }
will produce a sequence of saved .jpg images to the root of your Platform project folder. Ultimately you should have between 100 and 270 frames in your video, but I recommend starting with 10 and a substantial zoom factor (50%) to work out the code. Only after it's appears to be working, increase the frames to the final number and set your zoom factor to just under 1.0 to enable smooth scaling.
-
The drawMandelbrot(g) method introduced above is similar to the code you have in your paintComponent() method. Something fashioned after the following will suffice,
  public void drawMandelbrot(Graphics g) {
    Graphics2D g2 = (Graphics2D) g;

    // draw the fractal
    for (int c = 0; c < WIDTH; c++) {
      for (int r = 0; r < HEIGHT; r++) {
        // determine if that point is part of the set
        if (mandelbrot.isPartOfSet(c, r)) {
          g2.setColor(Color.BLACK);
        } else {
          g2.setColor(palette.getColor(fractal.iteration() % 256));
        }
        g2.drawLine(c, r, c, r);
      }
    }

  }
We will now bypass the Mandelbrot class with further enhancements and add resources directly to the Fractal class. First, you'll need something to house the coordinates of the fixed target of your zoom sequence. You could use an object of the Point2D.Double class, but I suggest you simply add the declaration below to your Fractal class,private double TARGET[] = new double [2];
along with the instance fields,
private double videoCentreX, videoCentreY, videoDomain, videoZoomFactor;
- Now you can add can add the bodies of the setVideoProperties() and nextFrame() methods to your Fractal Class that does the setup and update of the viewing parameters for each subsequent image.
- Of course you don't have to follow anything I've said above. I just ask you to submit original code that produces the results I need to stitch your sequence together into a video.
The deadline is midnight, Saturday June 4. All project source files and a sequence of up to 270 .jpgs are to be attached to your email to handin. Once I create and mount all your videos, I'll call for your recommendations for the three you think best reflect our efforts over the past month and showcase them on the SSD over the exam period.
KeyListener. The ability to record your Mandelbrot investigations either as still photos or animated sequences, would make it very easy to share your discoveries with family and friends. In this stage you will do just that.
Since we've already incorporated Mouse behaviour into this project, we'll attach your keyboard to the capability of recording your graphics canvas in .jpg format, amongst other features your imagination suggests. Look over the resources within the KeyListener interface and its associated KeyEvent class. As was the case in last stage, although all three methods are required, only the keyPressed(KeyEvent e) method requires a non-empty body. The strategy here is to obtain the keyCode of the KeyEvent object and using either a switch statement or if..else ladder, call various methods to perform the recording tasks. A method for saving of .jpgs can be adapted from the following, that will be triggered when the user presses the lowercase s key,
public void screenCapture()	{
  try {
    Robot robot = new Robot();
    BufferedImage screenShot = robot.createScreenCapture
      (new Rectangle(3,29, WIDTH-6, HEIGHT-7));
    File file = new File(mandelbrot.getClassName().toLowerCase()
      +"_"+zoomLevel+".jpg");
    javax.imageio.ImageIO.write(screenShot, "JPG", file);
  } catch(Exception e) {
    System.out.println("Exception found: " + e);
  }
}
A secondary method that uses a loop to assist with the creation
of multiple frames,
synchronized with automated zooming in can provide the basis for assembling
a zoom sequence into either an animated gif or Flash file.
 MouseListener. When you zoom in on the set
of points that form an arc of a circle, they appear to straighten out. This
is
a hallmark
of Euclidean geometry
and Newton capitalized
on it in
a big
way in developing the basis for Calculus. On the other hand, the most
compelling reality of Fractal geometry is that zooming in
on points outside the Set yields no similar simplification. At any level of
magnification, the level of complexity remains the same. Modify your Content class
to have it implement the MouseListener interface,
thereby allowing the user to zoom in on the image with a left button click and
zooming out with a right button click. So, to have your Content object enabled
for mouse
events, perform the following steps.
MouseListener. When you zoom in on the set
of points that form an arc of a circle, they appear to straighten out. This
is
a hallmark
of Euclidean geometry
and Newton capitalized
on it in
a big
way in developing the basis for Calculus. On the other hand, the most
compelling reality of Fractal geometry is that zooming in
on points outside the Set yields no similar simplification. At any level of
magnification, the level of complexity remains the same. Modify your Content class
to have it implement the MouseListener interface,
thereby allowing the user to zoom in on the image with a left button click and
zooming out with a right button click. So, to have your Content object enabled
for mouse
events, perform the following steps.
- Declare that your Content class implements the MouseListener interface
- Using the inherited java.awt.Component's addMouseListener(MouseListener ml) method, declare that your Content object is to be added to the list of objects that receive notification of Mouse events.
- Include bodies for the MouseListener methods. You can leave the bodies of all but the MouseClicked(MouseEvent e) method, empty.
- Add the method public void modifyBounds(int col, int row) to your Mandelbrot class that will accept the screen coordinates of the mouse hotpoint. This method will adjust the bounds array such that the hotpoint is at it's center and the domain and range are tighter.
- Issue a repaint() statement that will result in the system calling your paintComponent() to redraw set with the new bounds! Voilá: Zoom!
NOTE: It may be helpful to report current bounds and domain to the console window.

![]() Explorer 5: Animation. For the final stage of this year's Explorer project you are to produce a sequence of gif images that zoom in on a point of your choosing. Once completed, you will zip up these images into a file and send them to handin by the deadline. I will create a Flash video from your images and mount them in the ACES Fractal Archive. Click on the image to the right to view a sample Flash video created from the script: ElephantValleyCuspTrigonometric.exp
Explorer 5: Animation. For the final stage of this year's Explorer project you are to produce a sequence of gif images that zoom in on a point of your choosing. Once completed, you will zip up these images into a file and send them to handin by the deadline. I will create a Flash video from your images and mount them in the ACES Fractal Archive. Click on the image to the right to view a sample Flash video created from the script: ElephantValleyCuspTrigonometric.exp
There are a number of careful considerations that must be made in order to produce a good animation. Look at this example. This is a poor offering for a host of reasons that include: a zoom factor that is too high (0.50-you'll likely prefer a value between 0.90 and 0.99 to be smooth), at 30 frames it's too short (between 200 and 500 are required to keep the viewer engaged), and at deeper depths there weren't enough iterations to provide the necessary detail (you'll probably want 1000+).
Task.
- Using various tools (your Explorer project, the MandelbrotAndJuliaSetExplorer, Platform.jar,the Excel Trigonometric Palette Planner and a multitude of websites) determine the Complex coordinates of a point deep inside the field near the Mandelbrot Set that you find interesting.
- Develop a script entitled nnnnn.exp where nnnnn is your surname, that displays your image with dimensions of 400×400, centered about the point with a small delta, say in the 1E-6 range. Make any adjustments to the coordinates so that the point appears in the center of the image. Gradually decrease delta to 1E-10 or less, continually editing the coordinates as necessary to keep your chosen point in the center. At this depth, you will have to increase the value of bailout to 1000+ to give your algorithm sufficient exposure to reveal the detail and structure.
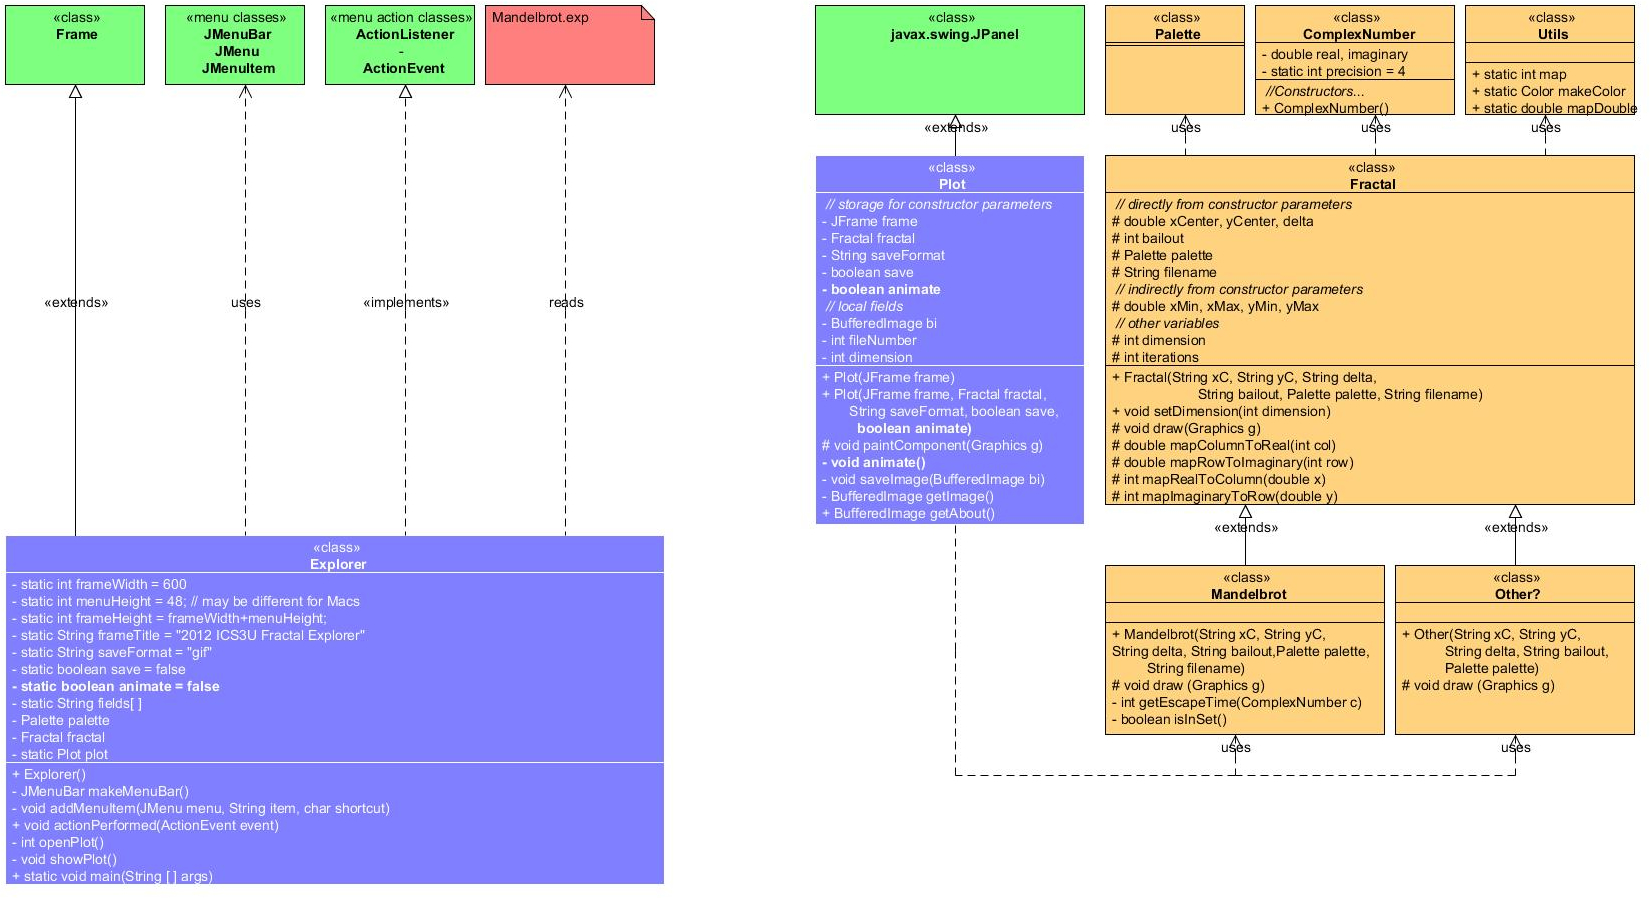
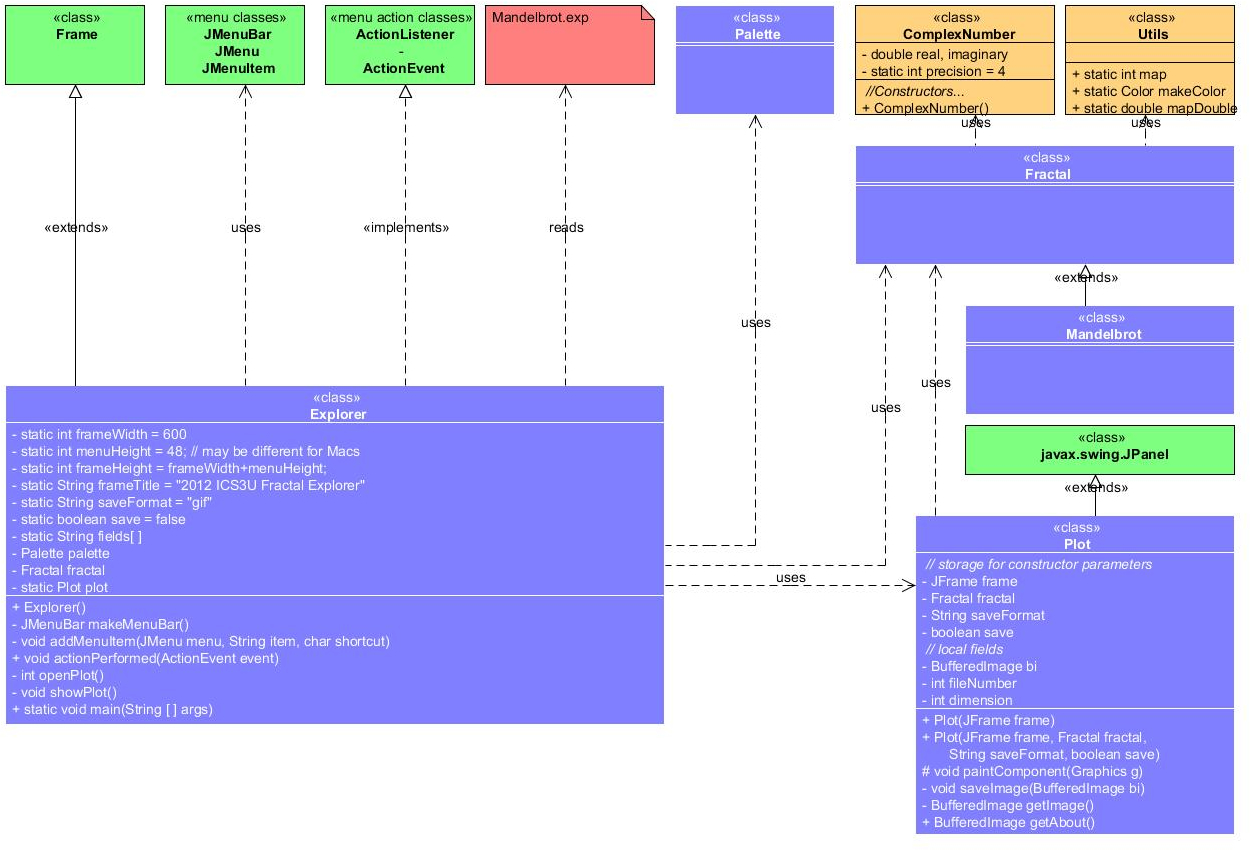
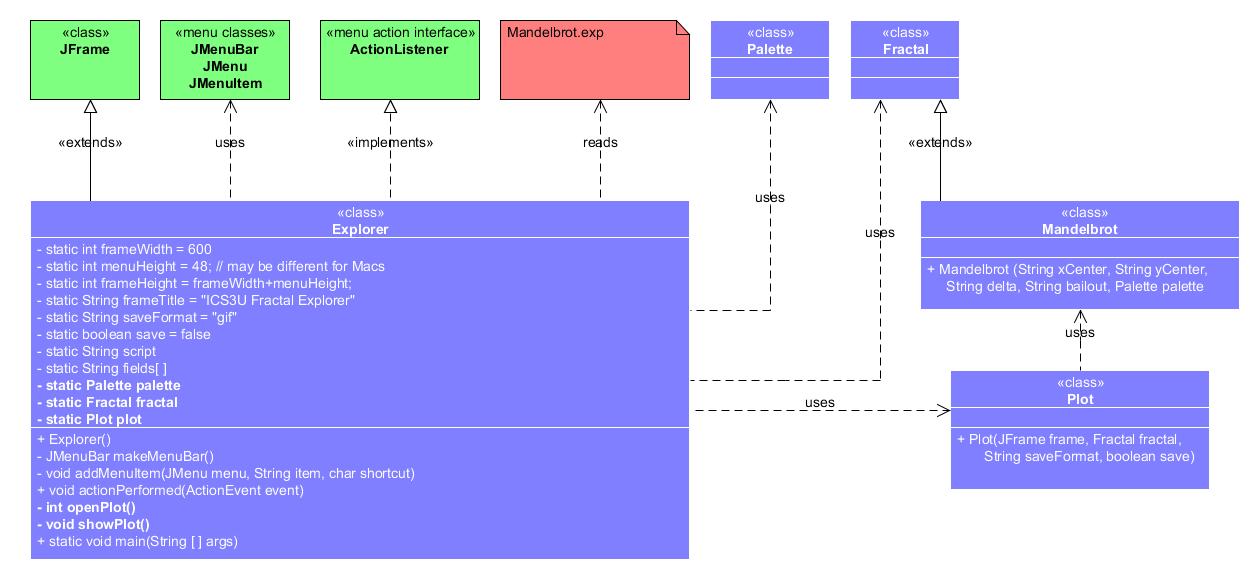
- Review the UML below. A few small changes to your Explorer driver will enable the handling of an additional boolean field on the Frame statement of your scripts to indicate whether the plot is to be animated.
- Modify your Plot class as suggested by the bold text in the UML. We'll develop the body of the animate() method together.
- Create the images and zip them up into the file nnnnn.zip where nnnnn is your surname.
- Document your source code and submit Explorer.java, Plot.java, Fractal.java, Mandelbrot.java, Palette.java, nnnnn.exp and nnnnn.zip that contains your sequence of gif images to handin under the Subject: Explorer 5. Animation by the deadline.
![]() Framework: The Palette Class. Rather than simply ignoring pixels for c value that escape the M-Set, colour can be used to reveal information about the orbit. A common colouring strategy is to use the number of iterations in the orbit it took to escape as an index into a palette of the users design.
Framework: The Palette Class. Rather than simply ignoring pixels for c value that escape the M-Set, colour can be used to reveal information about the orbit. A common colouring strategy is to use the number of iterations in the orbit it took to escape as an index into a palette of the users design.
 |
 |
|---|
Assuming an array of colours is available, any pixel for which its corresponding c value escaped the M-Set, is drawn in a color selected from the palette using the number of iterations as the index into the array. Use of the modulus operator % is useful to prevent ArrayIndexOutOfBoundsExceptions from occuring in situations where the bailout value exceeds palette's size. BLACK remains the colour of choice for points inside the M-Set. This strategy is referred to as the Escape-Time Algorithm. Given that various strategies exist for developing a palette, this is the point in your project where the artist in you takes center stage.
| ScepterValley (Monochrome) | ScepterValley (Grayscale) | ScepterValley (Trigonometric) |
|---|---|---|
 |
 |
 |
Task.
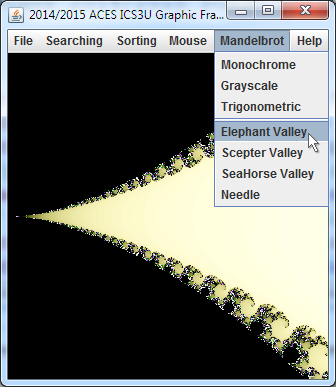
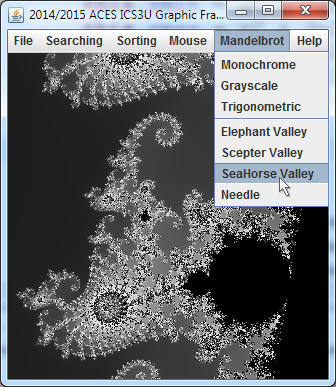
- Provide the additional menu items within the Mandelbrot menu as shown above and add each of them to Framework's actionPerformed() if..else ladder.
- The Palette Class. A simple and visually-appealing palette strategy is to assemble a smooth Grayscale ramp from black to white. Recall that gray tones arise when red, green, and blue values are all equal. A Monochrome palette has ALL entries in the palette set to a single colour (white for the time being). Download the partially-completed source code for the Palette class, drop it into your Framework application and review its contents.
- Instantiate two new Palette objects (monochrome and grayscale) appropriately, as global Framework references.
- Modify the Mandelbrot constructor to accept a Palette object as a fifth parameter. Modify the instantiations from the actionPerformed method to include one of the two Palette objects.
 Modify your Mandelbrot class to draw pixels for c values outside the M-Set using a colour indexed within the palette based on the number of iterations it to to escape the Set.
- (Trigonometric) The randomly-generated palette results in an unsightly presentation by placing unrelated colours adjacent to one another. Smoother transitions between regions yields a more appealing visual experience. To achieve this effect, we incorporate our knowledge of the sine function into the creation of the Color palette.
A review of the various Color constructors reveals one that accepts float values in the range from 0.0 to 1.0 for the red, green and blue parameters (the second one). Appropriately-scaled sine functions can easily supply smooth ramping over this range. A domain stretched over the palette size would be perfect.
To summarize:
- Define RGB colour contributions as asin(bx+c)+d
- Design for use with Color(float,float,float) where float:[0.0,1.0)
- Ensure wraparound to avoid 'color borders'
- Design for periods of integral (1..4) fractions of palette size
Examine this Excel workbook to assist with a review of the basic transformations associated with the sine function (if the scroll bars do not function on a Mac, you'll simply have to type in some of the data). Ensuring the period was equal to the palette size would eliminate any unsightly borders as the lower and upper values of the sine wave would connect. With the amplitude and vertical translations set to 0.5, all that would be required to create different trigonometric palettes would be to randomly generate a value for the phase shift between 0 and the size of the palette for each of the three color streams.

![]() Framework: The Mandelbrot Set (with Save).
You have reached the stage for which concepts examined in preliminary studies can be integrated into your Framework application.
Framework: The Mandelbrot Set (with Save).
You have reached the stage for which concepts examined in preliminary studies can be integrated into your Framework application.
Your most recent study considered the behaviour of a single `c` value in the context of the feedback formula `z_(i+1) larr z_i^2+c`. Those `c` values that orbited inward were determined to lie within the Mandelbrot Set (M-Set) and those that spiraled outward, escaped the M-Set.
For this stage, you are asked to provide a plot of ALL `c` values (mapped from pixels based on screen coordinates ) within a square subset of the Argand Plane bounded by,
`[xmin,xmax,ymin,ymax]=[-2.25,0.75,-1.5,1.5]`
Pixel coordinates corresponding to `c` values that lie within the M-Set (ie., do not escape) are to be coloured black. Those that do escape are not plotted.
Task.
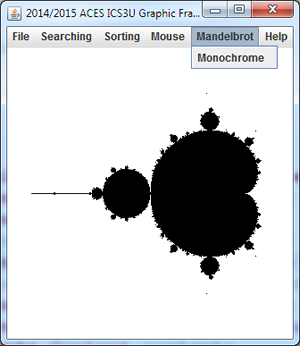
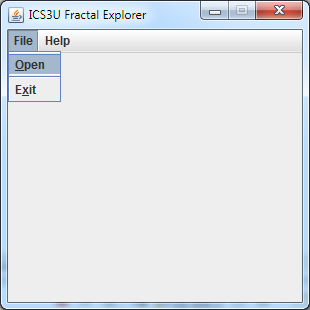
 Create a new Framework menu entitled Mandelbrot and add the submenu, Monochrome, as shown above right.
- Reduce your application dimensions to 300x300 for the time being. This results in faster rendering in the short run.
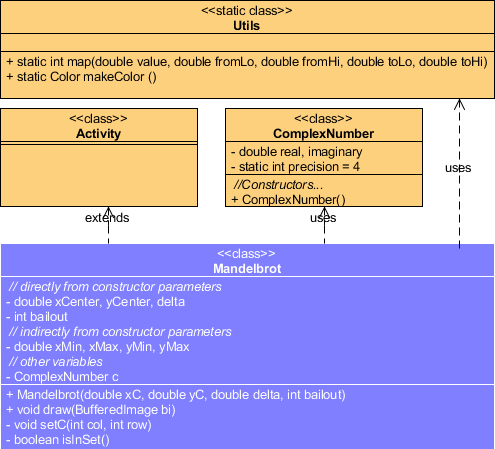
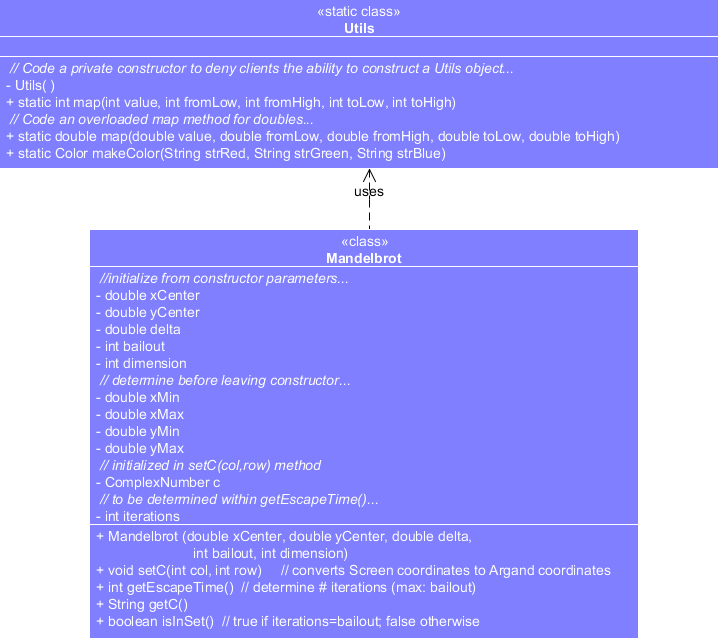
- The Mandelbrot class you wrote for the previous MandelbrotTest project needs to be adapted for inclusion into your Framework project resulting in the generation of the image above right. Study the UML to the right before implementing the classes. Implement Utils as a static inner class just as we did with ArrayUtils awhile back.
- Confirm your draw() method's ability to save the result as a gif image under the name, Mandelbrot_0000.gif.
- Test different values for the constructor parameters: xCenter, yCenter, delta, and bailout to confirm your code can react appropriately (ie. zoom in). Use the 2009 Showcase Applet by way of comparsion.
- Code the required elements into your Plot class as defined by the UML diagram below.
- You'll notice Plot has an additional constructor that accepts the JFrame object as its only parameter. The purpose of this constructor is to use the dimensions of the JFrame to assist in creating an opening About panel that appears at application launch and each time you launch the Help | About menu item (hint..hint). Specifically, the constructor should call the getAbout() method for a BufferedImage object that the paintComponent method will subsequently display. This is an opportunity for you to demonstrate your creativity in preparation for what's ahead. Follow the Java 2D Graphics Tutorial Trail to learn the basic techniques of drawing and filling graphic primitives, text and images.
- Once Explorer's showPlot() method is implemented, modify your Explorer constructor to ensure the Plot's About panel is displayed at launch.
- Be sure to test your project thoroughly before submission.
- Submit Required Files: Explorer.java and Plot.java and other source code required to test this stage.
![]() Explorer 1: The Driver.
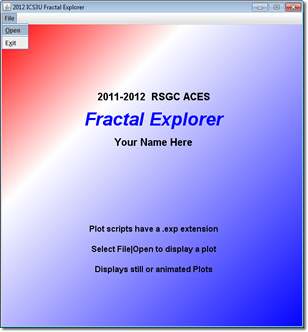
In this stage we code the driver for the Explorer application. To prepare for the eventual reading of .exp scripts, a menu bar is added enabling (for now) the limited ability to Open a file and Exit the application.
Explorer 1: The Driver.
In this stage we code the driver for the Explorer application. To prepare for the eventual reading of .exp scripts, a menu bar is added enabling (for now) the limited ability to Open a file and Exit the application.
Task.
- Review the UML below and familiarize yourself with the contributing classes.
- Create a project called Explorer and add a driver by the same name.
- Enter the supplied code that we have discussed, adding comments as you go. This will help familiarize you with the details.
- Accept Eclipse's offer of code completion for classes and their constructors to cut down the entry time need for the project to compile and produce the result presented to the right, but be aware of the decisions you are making and edit as required.
- After javadocing the source files to the extent possible, submit the files Explorer.java, Plot.java, Fractal.java, Mandelbrot.java, and Palette.java by the deadline under the Subject Line Explorer 1. Driver.
![]() The Mandelbrot Class. The Mandelbrot Set consists of the set of points, c, in the Complex (Argand)
Plane, whose orbit under the iterative formula, z ← z2+c never
reaches a magnitude greater than 2.0 (given sufficient opportunity),
where z starts
at 0+0i.
The Mandelbrot Class. The Mandelbrot Set consists of the set of points, c, in the Complex (Argand)
Plane, whose orbit under the iterative formula, z ← z2+c never
reaches a magnitude greater than 2.0 (given sufficient opportunity),
where z starts
at 0+0i.
Task.
- Drop this driver into your Framework Project to
exercise an instance of the Mandelbrot class
defined in the UML below.
-
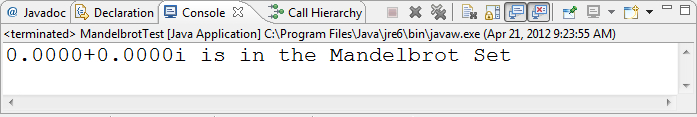
The supplied driver selects a point within a 600×600 screen space and sets it to a corresponding complex number c, within a 3×3 Argand space, centered at (-0.75,0). It then asks the Mandelbrot object to test a characteristic of the orbit of c (similar to the previous Orbit project). The result of the test is used to declare whether the point is in the Mandelbrot Set, or not.
 |
 |
|---|
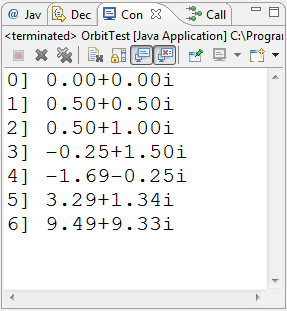
![]() The ComplexNumber Class. The Mandelbrot Set is based on complex numbers (a.k.a. imaginary numbers - you remember these from your study of the roots of quadratic equations for which the corresponding parabolas did not have x-intercepts). To condition you for the authoring of a ComplexNumber class on your own, we will develop a similar class together. Create a project by the name of RealNumberTest and drop in this driver. From observation, note that the successful execution of this project requires the development of a RealNumber class. This class appears to formally encapsulate a real number and offers a constructor, a few arithmetic methods and a toString method. Collaborative development of a RealNumber class should yield the output below.
The ComplexNumber Class. The Mandelbrot Set is based on complex numbers (a.k.a. imaginary numbers - you remember these from your study of the roots of quadratic equations for which the corresponding parabolas did not have x-intercepts). To condition you for the authoring of a ComplexNumber class on your own, we will develop a similar class together. Create a project by the name of RealNumberTest and drop in this driver. From observation, note that the successful execution of this project requires the development of a RealNumber class. This class appears to formally encapsulate a real number and offers a constructor, a few arithmetic methods and a toString method. Collaborative development of a RealNumber class should yield the output below.

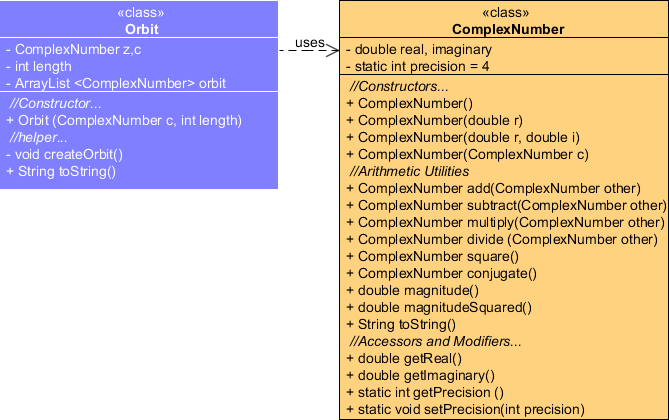
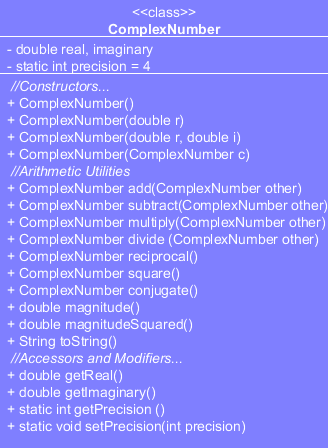
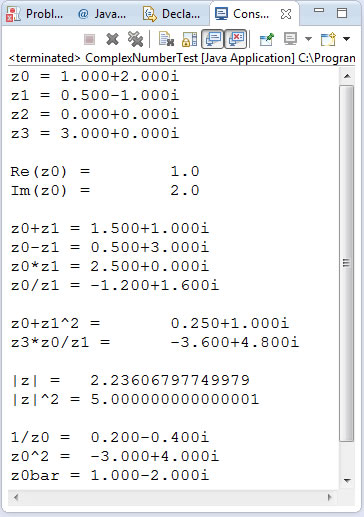
The ComplexNumber Class. Using the driver, ComplexNumberTest.java, develop the ComplexNumber class defined in the UML diagram below. Run the project and confirm that your results match the output below.
| ComplexNumber UML | ComplexNumberTest Output |
|---|---|
 |
 |